USDA Hardiness Zone 7b
Frost Dates for 37725 — Dandridge, Tennessee
NOAA 1991–2020 normals from Jefferson City, TN (1,108 ft), 10 miles northwest.
Updated
In Dandridge, the last spring frost (32°F) is around April 24 in half of years and has passed by May 13 in nine years out of ten. The first fall frost comes around October 17, as early as October 6 one year in ten, leaving a typical freeze-free season of 175 days (NOAA, Jefferson City, TN).
- Last spring frost
- April 24
- First fall frost
- October 17
- Growing season
- 175 days
- Hardiness zone
- 7b
50% probability
50% probability
freeze-free, 50%
5 to 10°F (-15.0 to -12.2°C) coldest night
- First snow
- January 20
- Last snow
- February 14
- Winters with snow
- 84%
- Snow per year
- 3"
median, 1991–2020
median, 1991–2020
16 of 19 observed
NOAA normal
Frost risk by date in Dandridge
Half of springs at Jefferson City, TN see their last 32°F night by April 24; only one in ten is past it by April 10, and one in ten still has one after May 13. Planting tender crops after May 2 leaves a 30% risk of a frost on them, after May 7 20%, and after May 13 10%. The 19 days between the even-odds date and the one-in-ten date is wider than at 84% of the 144 Tennessee stations behind this site's ZIP pages.
In fall the first 32°F night comes by October 17 in half of years, as early as October 6 one year in ten, and holds off past November 1 one year in ten. A hard freeze of 28°F follows 10 days later, around October 27; in spring the one-in-ten date for 28°F is May 1, 12 days before the 32°F one. The freeze-free season lasts 175 days in a typical year, shorter than at 99% of the 144 Tennessee stations; it reaches 196 days one year in ten and falls short of 151 one year in ten. On average 103 nights a year drop to 32°F or below. Nights of 36°F, when frost can still settle on leaves in low, open spots, continue 12 days longer, to about May 6, and return around October 10. Severe cold of 16°F or below comes every winter, usually between December 1 and March 5.
| Low | 90% | 80% | 70% | 60% | 50% | 40% | 30% | 20% | 10% |
|---|---|---|---|---|---|---|---|---|---|
| 36°F | Apr 21 | Apr 25 | Apr 30 | May 3 | May 6 | May 8 | May 12 | May 16 | May 21 |
| 32°F | Apr 10 | Apr 15 | Apr 19 | Apr 22 | Apr 24 | Apr 29 | May 2 | May 7 | May 13 |
| 28°F | Mar 28 | Apr 1 | Apr 5 | Apr 7 | Apr 11 | Apr 15 | Apr 19 | Apr 24 | May 1 |
| 24°F | Mar 13 | Mar 19 | Mar 24 | Mar 28 | Mar 31 | Apr 2 | Apr 5 | Apr 9 | Apr 19 |
| 20°F | Feb 24 | Mar 4 | Mar 10 | Mar 15 | Mar 19 | Mar 23 | Mar 26 | Mar 30 | Apr 3 |
| 16°F | Feb 3 | Feb 13 | Feb 21 | Feb 28 | Mar 5 | Mar 10 | Mar 15 | Mar 20 | Mar 26 |
| Low | 10% | 20% | 30% | 40% | 50% | 60% | 70% | 80% | 90% |
|---|---|---|---|---|---|---|---|---|---|
| 36°F | Sep 28 | Oct 3 | Oct 6 | Oct 8 | Oct 10 | Oct 13 | Oct 15 | Oct 18 | Oct 22 |
| 32°F | Oct 6 | Oct 10 | Oct 12 | Oct 15 | Oct 17 | Oct 20 | Oct 23 | Oct 27 | Nov 1 |
| 28°F | Oct 13 | Oct 17 | Oct 21 | Oct 24 | Oct 27 | Oct 29 | Nov 1 | Nov 4 | Nov 8 |
| 24°F | Oct 21 | Oct 26 | Oct 29 | Nov 1 | Nov 4 | Nov 6 | Nov 10 | Nov 15 | Nov 23 |
| 20°F | Oct 31 | Nov 4 | Nov 8 | Nov 12 | Nov 16 | Nov 21 | Nov 26 | Dec 1 | Dec 6 |
| 16°F | Nov 7 | Nov 15 | Nov 21 | Nov 27 | Dec 1 | Dec 5 | Dec 11 | Dec 20 | Dec 31 |
Freeze probabilities 1991–2020 at Jefferson City, TN, from NOAA NCEI U.S. Climate Normals. Where a temperature is reached in fewer than 99.5% of years, the dates describe only the years that reach it. Not a forecast.
Frost risk on any date in 37725 →Compare Dandridge with another place →
Frost risk through the year in Dandridge
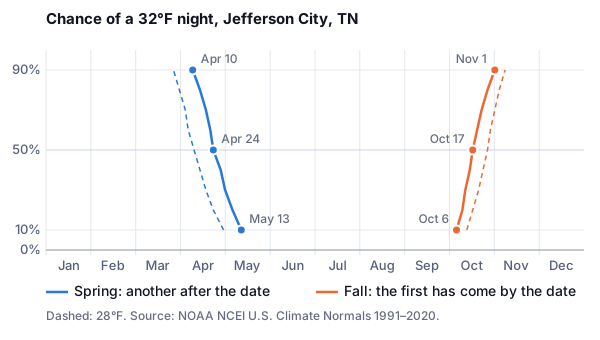
In Dandridge, the spring curve drops under 10% on May 13 and the fall curve passes 10% on October 6, 146 days later; that gap is shorter than at 97% of the 144 Tennessee stations with frost dates. The spring risk falls from 90% to 10% over 33 days (April 10 to May 13) and the fall risk climbs from 10% to 90% over 26 days (October 6 to November 1): the last frost moves more from year to year than the first. At Newport 1 NW, TN, 11 miles east, the same gap runs from April 23 to October 17, 31 days longer.
| Planted on | Another 32°F night | 28°F night |
|---|---|---|
| Apr 10 | over 90% | 53% |
| Apr 17 | 75% | 35% |
| Apr 2450% date | 50% | 20% |
| May 1 | 33% | under 10% |
| May 8 | 18% | under 10% |
| May 15 | under 10% | under 10% |
Weather by month in Dandridge
July is the warmest month at Jefferson City, TN, averaging 87°F by day and 63°F at night; January is the coldest at 47°F and 25°F. A freezing night is all but certain in every month from November to April (a 90% chance or more). From June to September the chance of a 32°F night stays under 10% each month. In spring, May still brings one in 34% of years.
Warmth for growing adds up to 3,763 growing degree days a year (base 50°F), fewer than at 89% of the 144 Tennessee stations. 37% of them (1,378) have built up by the end of June, and July adds the most, 773. Precipitation totals 48.6 inches a year, most in July (5.1") and least in October (2.7"); May to September bring 41% of it.
| Month | High °F | Low °F | Precip. in | 32°F night | Nights ≤ 32°F | GDD 50°F |
|---|---|---|---|---|---|---|
| Jan | 47 | 25 | 4.1 | 100% | 22 | 8 |
| Feb | 51 | 27 | 4.5 | 100% | 19 | 15 |
| Mar | 61 | 32 | 4.6 | 100% | 14 | 63 |
| Apr | 70 | 41 | 4.6 | 98% | 5 | 197 |
| May | 78 | 50 | 4.1 | 34% | 1 | 442 |
| Jun | 84 | 59 | 3.8 | 0% | 0 | 652 |
| Jul | 87 | 63 | 5.1 | 0% | 0 | 773 |
| Aug | 87 | 62 | 3.8 | 0% | 0 | 750 |
| Sep | 82 | 55 | 3.3 | 3% | <1 | 548 |
| Oct | 71 | 42 | 2.7 | 90% | 6 | 237 |
| Nov | 60 | 32 | 3.4 | 100% | 15 | 62 |
| Dec | 50 | 27 | 4.6 | 100% | 22 | 15 |
Monthly normals 1991–2020 at Jefferson City, TN (1,108 ft), NOAA NCEI. "32°F night": chance of at least one in the month. GDD: growing degree days, base 50°F.
Compared with the next station
The nearest other station, Newport 1 NW, TN, 11 miles east of Dandridge, has a last frost 17 days earlier (April 7), a first frost 12 days later (October 29), a season 28 days longer.
When it snows in Dandridge, Tennessee
The first measurable snow (0.1 inch or more) in Dandridge usually arrives around January 20, and the last of the season around February 14. Those are the middle dates across the winters of 1991–2020 at Jefferson City, TN, 9.7 miles away: half of years saw snow earlier, half later. Snow fell in 84% of those winters. The last 32°F night of spring typically comes 69 days after the last snow.
Planting calendar for 37725
| When | What to do |
|---|---|
| February 13 – February 27 | Start peppers and aubergines indoorsThey need eight to ten weeks under lights before they can go out. |
| February 27 – March 13 | Start tomatoes indoorsSix to eight weeks gives a transplant big enough to set fruit early. |
| March 27 – April 10 | Sow peas, spinach, lettuce, radish outdoorsThese tolerate light frost and prefer to germinate in cool soil. |
| April 24 onward | Transplant tomatoes, peppers, basil, squash, cucumbersThe average last freeze has passed — still watch the actual forecast. |
| by July 25 | Sow the autumn crop of carrots, beets and brassicasThey need about twelve weeks to size up before growth stops. |
| by October 3 | Harvest tender crops, or be ready to cover themA first freeze two weeks early is well within normal variation. |
| October 17 onward | Plant garlic, mulch beds, lift tender bulbsGarlic wants a cold spell; bare soil loses structure over winter. |
The weeks before and after the 50% dates are general rules of thumb, not NOAA figures; a seed packet gives the timing for each variety.
Where these figures come from
ZIP 37725 is 10 miles from Jefferson City, TN, which stands at 1,108 feet, the nearest NOAA station that publishes freeze probabilities for 1991–2020. 4 other ZIP codes share the station. The 2023 USDA Plant Hardiness Zone Map lists ZIP 37725 in zone 7b, the band where the coldest night of the year averaged 5 to 10°F (-15.0 to -12.2°C) over 1991–2020; a zone describes winter lows, not frost dates.
Frost dates across Tennessee →
Hardiness zone and temperature range: USDA Plant Hardiness Zone Map 2023 (USDA-ARS, Oregon State University), ZIP-code listing, unchanged. °C converted from °F by this site.
Thirty-year averages, not a forecast: check the forecast before planting out. How stations are matched and which pages are offered to search engines: methodology.